Tutorial tio2peakfit
Peak fitting
Files needed: d5_05005.raw
Learning outcomes: How to fit peaks in a powder pattern using a single overall peak shape to obtain accurate 2-theta values for indexing . This method lets you spot easily if certain reflections are broader than others. This could indicate they’re from a different phase or that what looks like one reflection is actually two closely spaced reflections. There are lots of ways of fitting peaks with individual fwhm’s which you can explore; see, for example, the tutorial on determining the instrument resolution function for Y2O3.
Methodology: The easiest way to do this in TOPAS Academic is to read a data file into the TOPAS gui and let it perform an automatic peak search to obtain approximate 2-theta values and intensities. These values are then copied and pasted into an INP file in topas-editor and positions/areas refined.
The tutorial assumes that you have VS Code and the topas-editor extension installed. Many of the basic topas-editor ideas are covered in the simple Rietveld tutorial.
1. Save the files listed above in your directory.
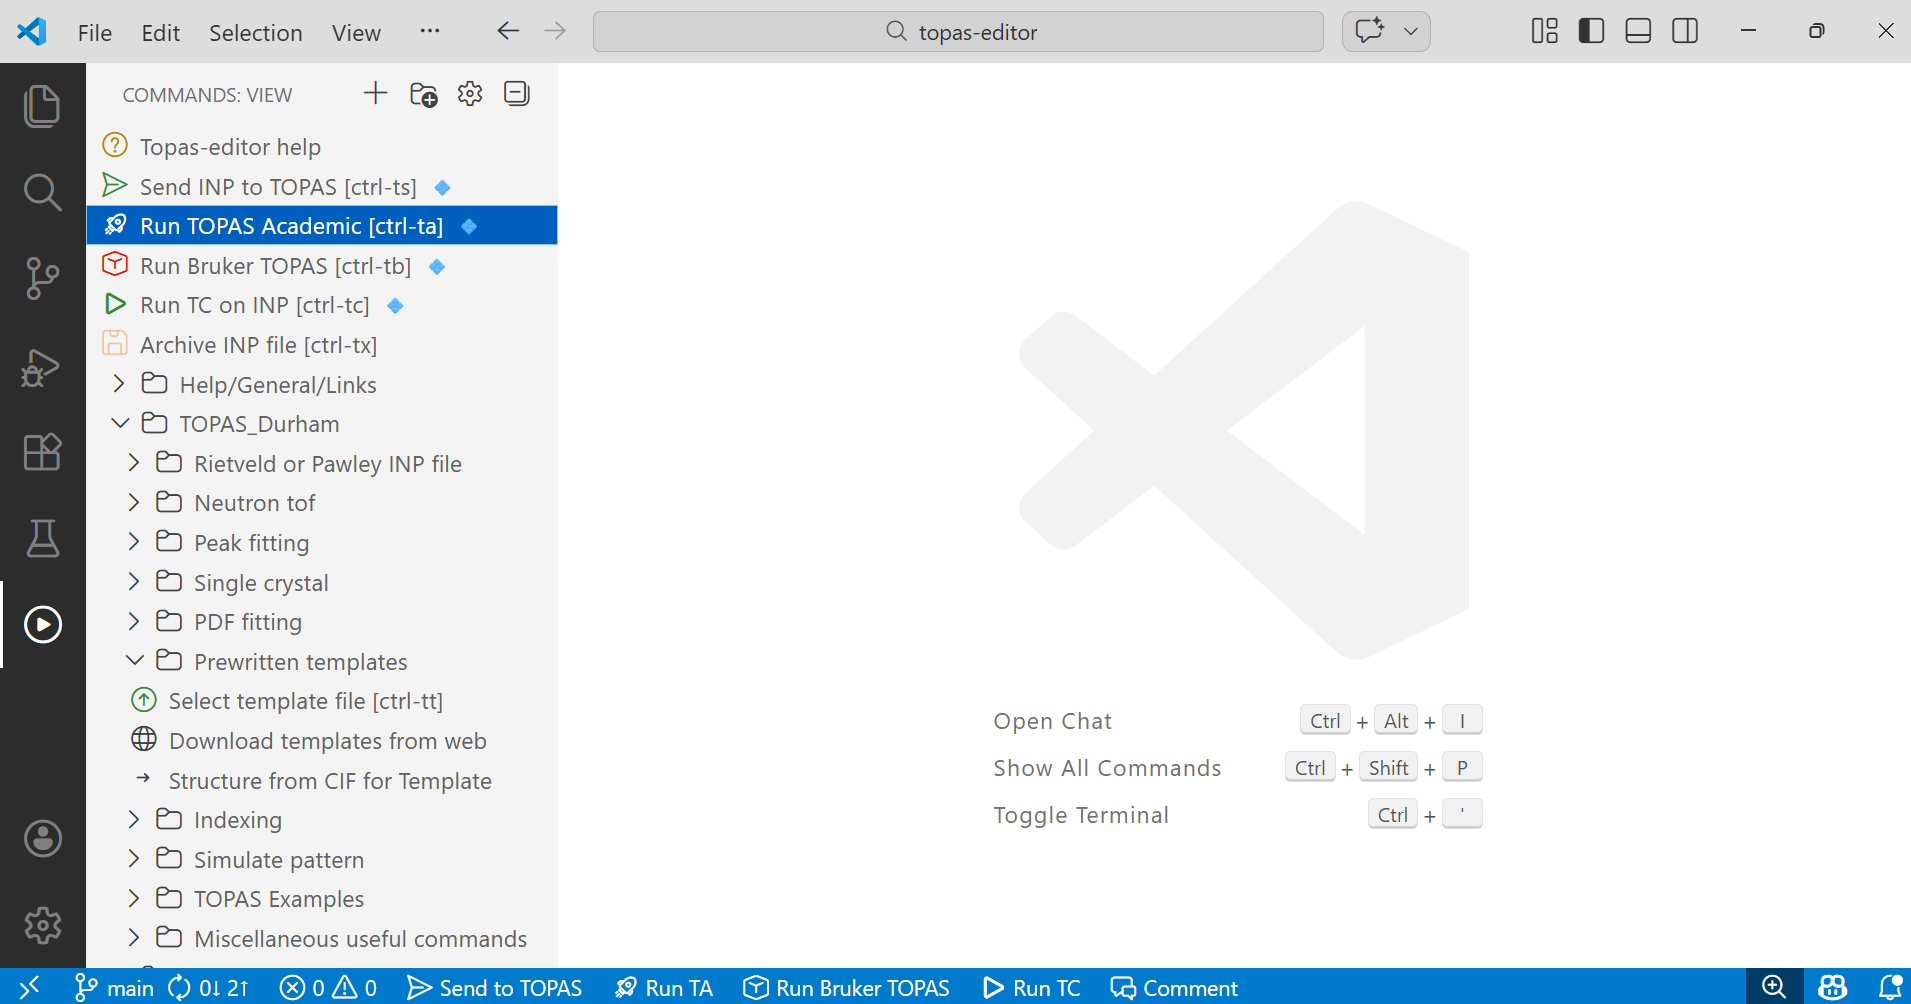
2. Open VS Code and launch your version of TOPAS by clicking on “Run TOPAS Academic” or “Run Bruker TOPAS” (ctrl-ta, ctrl-tb). These icons are in the top left of the default topas-editor screen below.
3. Switch to TOPAS and use “File/Load Scan files” from its menus to read in data, or hit ctrl-D.
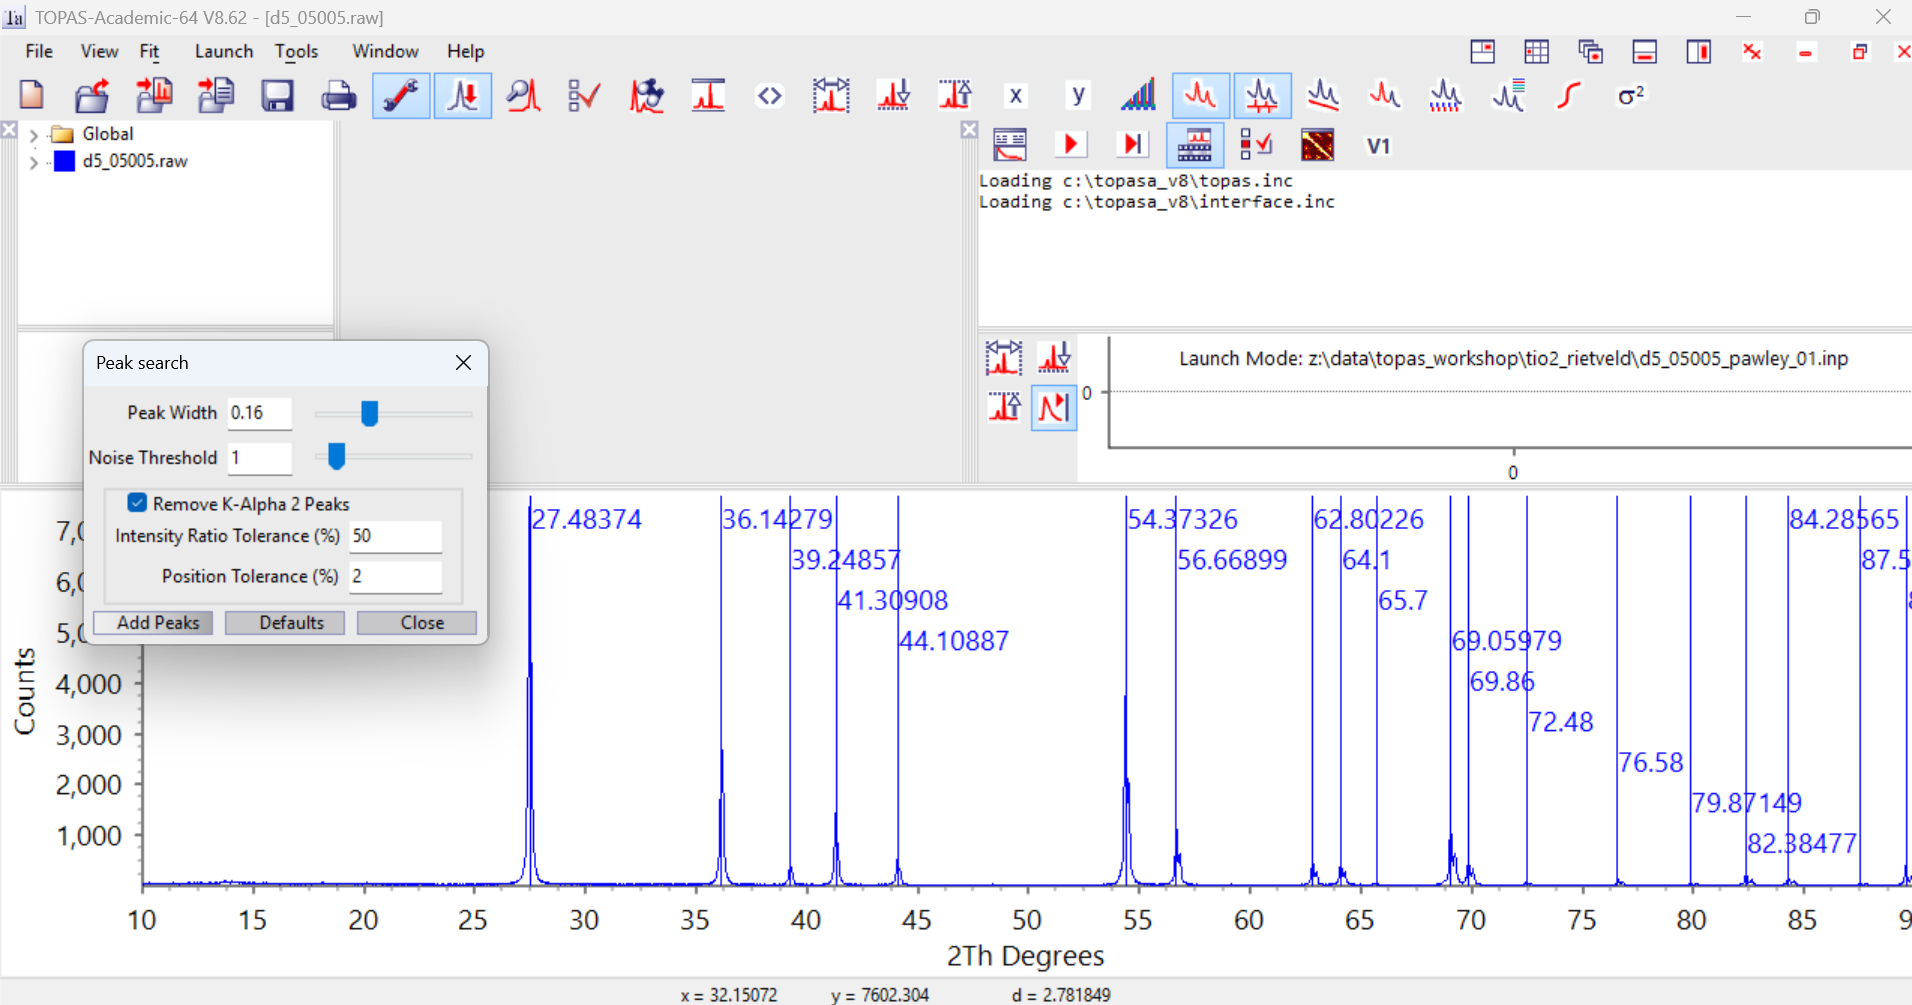
4. Use “View/Search Peaks” to search for peaks. Lines should appear on the screen showing where peaks have been found. Click on the “Add Peaks” button in the dialogue window and the approximate 2-theta positions will be saved in the TOPAS Parameters window. For this Cu Kalpha1/2 data set the default search parameters work well, but you can tweak them if needed. The screen will look something like the image below. If you don’t see the “Parameters” and “Refine” windows then hit F2/F5 to open them.
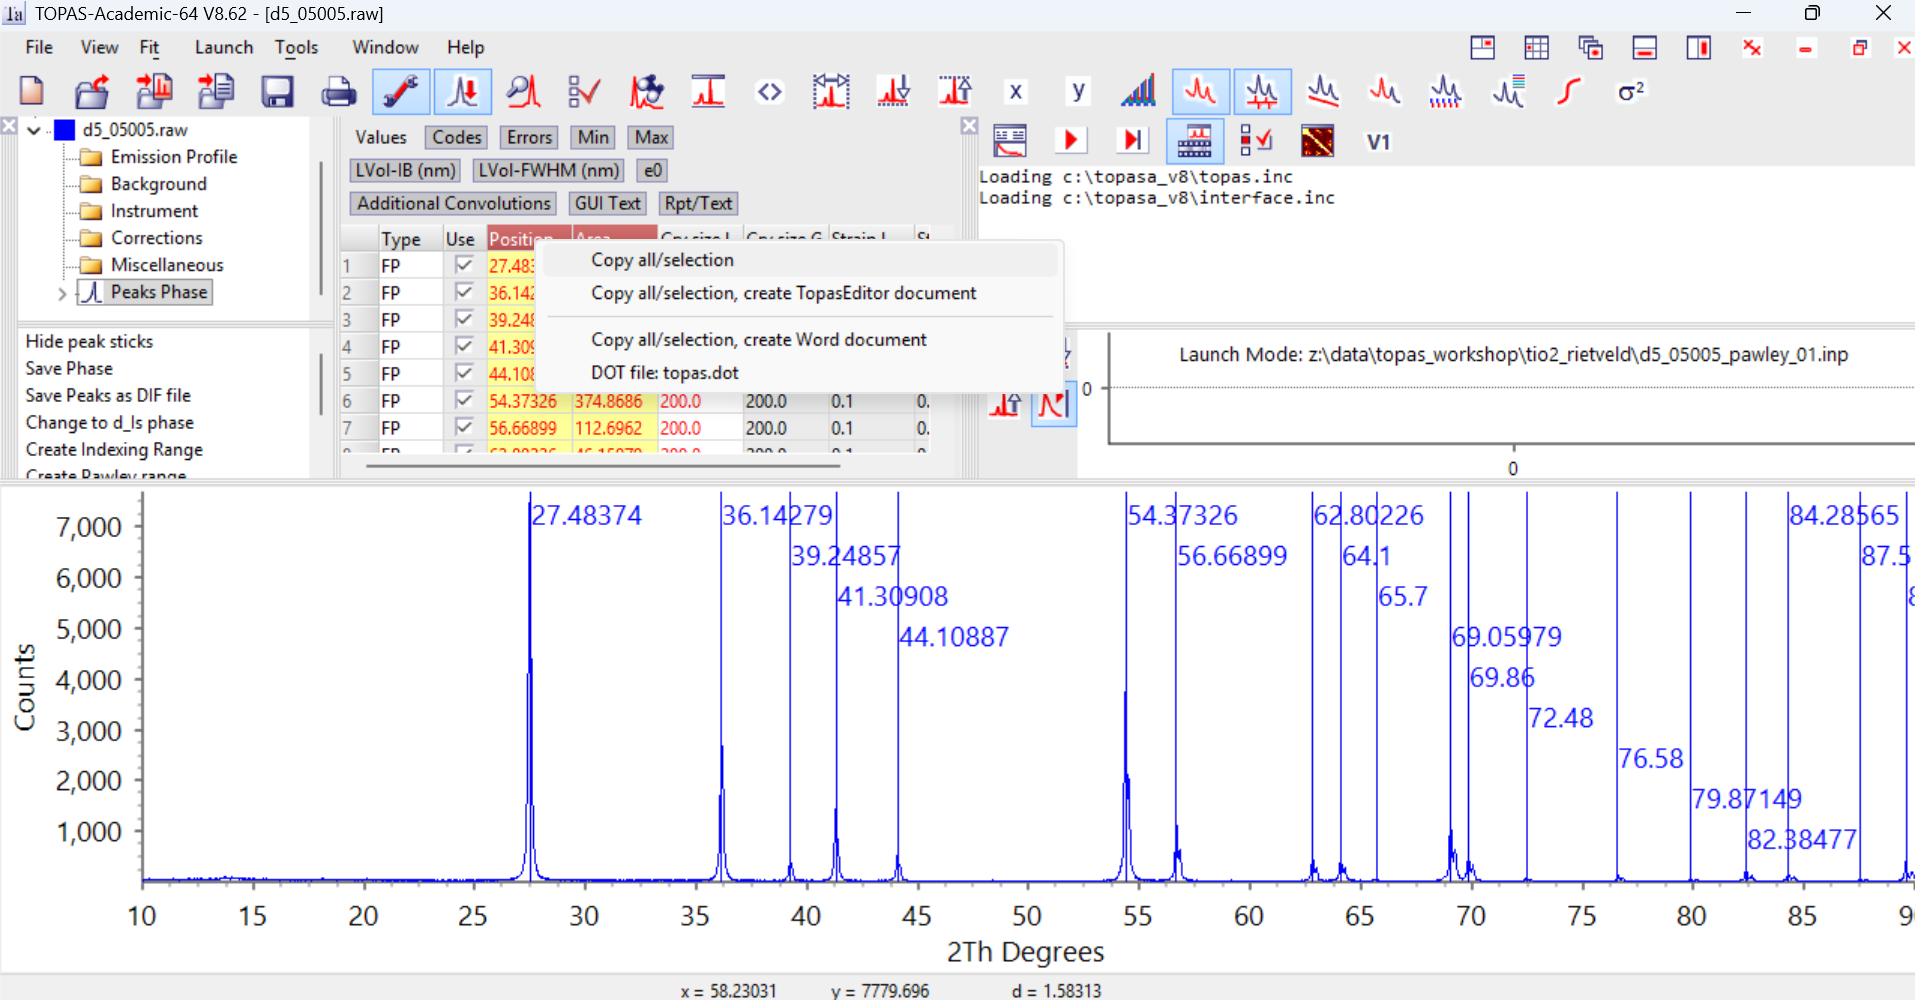
5. Click on the “+” sign next to the d5_05005.raw filename in the Parameters window (hit F2 if it’s not visible). Then click on “Peaks Phase”. A list of peak positions should appea to the right. Click on the “Position” and “Area” columns to highlight them. Right click on the yellow highlighted columns and select “Copy all/selection”.
6. Switch to topas-editor (alt-tab), select then save the “peak_fitting_template.inp” from “TOPAS_Durham/Peak fitting” menu. Enter the requested information on every line with a -> purple arrow. In this case the default emission profile is fine.
[If you use jEdit, work your way through the menus under “Peak Fitting”, selecting “Durham_d5000” as the instrument.]
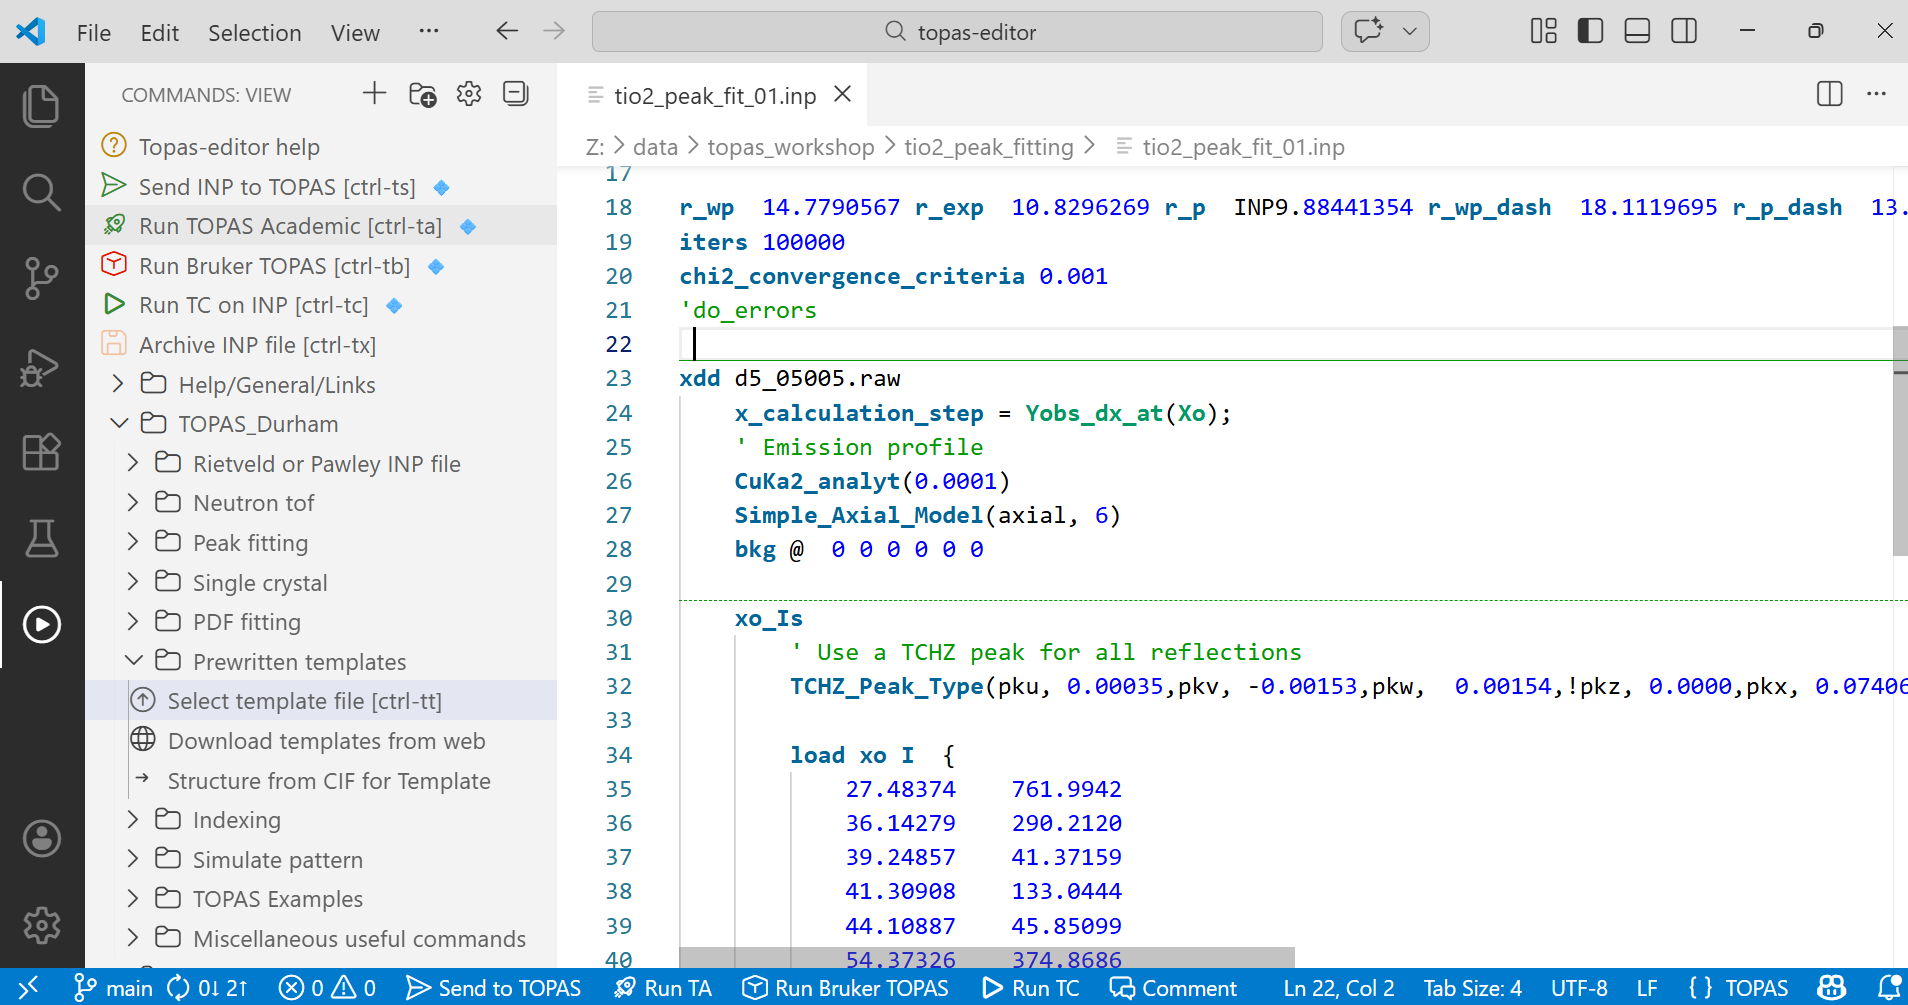
9. Paste the approximate 2-theta and Area values from the clipboard to the relevant part of the INP file (there is text around line 43 to tell you where!). Delete or comment out the line saying “Position Area”. After a bit of editting and deleting some of the comment lines that suggest different approaches, the INP file should like like the image below:
10. Click on the “Send INP to TOPAS” tree item (or ctrl-ts).
11. Switch to TOPAS and run the refinement (F6). If you already have the data loaded from the peak seach you might choose to turn it off (click on the box next to its name in the Parameters window) or reset TOPAS using “ctrl-N” or “File/Close all” or by clicking the orange rectangle icon just below the File menu. You should get Rwp of 40+ % initially. You may get the error “Expecting Numeric at Area” when you try and refine in TOPAS. If this happens, it’s because you’ve left the text “Position Area” in your INP file. Return to topas-editor and either delete or comment this line out and try again.
12. Try refining the peak areas by putting an @ symbol in front of each intensity in the INP file. Remember this is two keystrokes if you use the column editing feature of topas-editor: click in front of the first intensity (761.9942 in example above), hold down shift-alt, then click in front of the last intensity, then type “@ “.
If your columns aren’t nicely aligned: highlight them, right-click, select “Align-columns: by separator”, type a space in the dialogue box.
Switch back to TOPAS and refine. You should now get a Rwp of ~ 16 %.
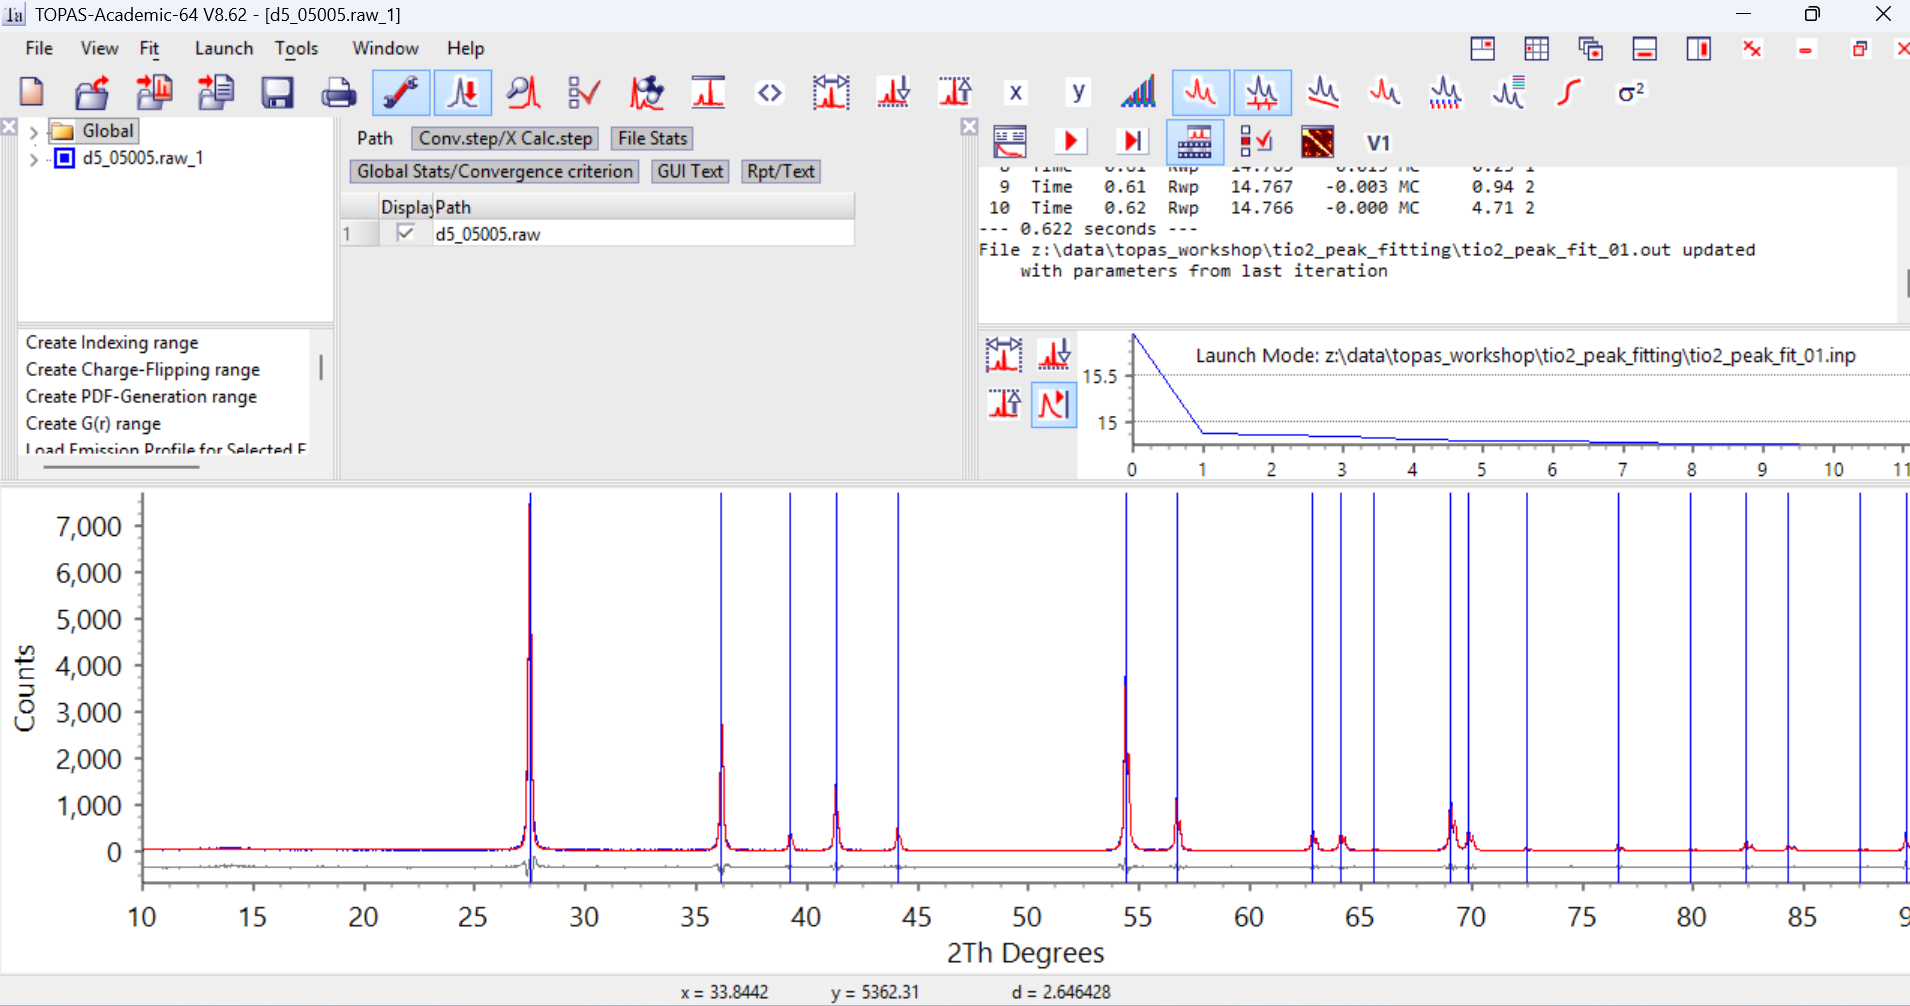
13. Try refining 2-theta values by putting an @ symbol in front of each 2-theta value. You should now get an Rwp of ~ 14.8%. The final fit in TOPAS should look something like the image below.
With individual peak fitting it is important to release the 2-theta values and intensities gradually like this to prevent peaks jumping to fit other parts of the pattern when the model is far from the global minimum.
14. The INP file now contains a list of 2-theta values that are fitted using a single peak shape and the 2-theta values obtained take into account any asymmetric contribution to the peak shape which can shift the postion (here axial divergence). This should give the best set of 2-theta values for indexing.
15. In a real world example it can often be useful to include an internal standard like Si when the data are recorded. You can then use a Rietveld model to fit the Si using its known cell parameter and apply any 2-theta corrections needed to correct the experimental Si peak positions to those expected. The peak positions from the unknown sample will then have the same corrections applied. In some cases this can make an unindexable sample indexable, or help improve the indexing figure of merit such that the correct solution stands out clearly from incorrect solutions.
16. Extra work: you might want to compare this Rwp and quality of fit to that obtained in the Rietveld tutorial of the same data set (Rwp ~ 13.8 %). Instead of using a TCHZ function to fit the peaks you could try using a Gaussian or Lorentzian with either a single fwhm, or a fwhm that is broadened by size/strain effects. Instructions are in the template INP. These models give a better fit with fewer parameters (Rwp ~ 13 %).
17. A cheat file is here.