Tutorial stacking faults
Stacking fault refinements in TOPAS v6+
Files needed: dia_tutorial01.inp; diffax_dia.xye; clustdia_tutorial_01.inp; clustdia.xye; cu_tutorial_01.inp; cu.xye
Learning Outcomes: Topas v5 and v6+ contain a number of features which allow you to model the peak shapes from materials which show stacking faults. In particular, versions 6 onwards contain significant speed ups which allow either the use of very large supercells or the efficient averaging of the diffraction from multiple smaller supercells. This allows quantitative and simultaneous analysis of structure and microstructure in complex stacking-faulted samples using a small number of physically meaningful prarameters.
The language used in TOPAS is deliberately similar to that used in DIFFaX, and the “experimental” data sets in these examples were simulated from the standard input files distributed with DIFFaX. DIFFaX is described in [1] and in the excellent DIFFaX manual (google it to get the pdf). Some of the details of the TOPAS implementation are in the paper linked in the pdf here [2, 3]. The examples were also disussed at the Bari TOPAS user meeting.
[1]. Treacy, M. M. J., J. M. Newsam, and M. W. Deem. “A general recursion method for calculating diffracted intensities from crystals containing planar faults.” In Proceedings of the Royal Society of London A: Mathematical, Physical and Engineering Sciences, vol. 433, no. 1889, pp. 499-520. The Royal Society, 1991.”
[2]. Coelho, Alan A., J. S. O. Evans, and J. W. Lewis. “Averaging the intensity of many-layered structures for accurate stacking-fault analysis using Rietveld refinement.” Journal of Applied Crystallography 49, no. 5 (2016): 1740-1749.
[3] Ainsworth, Chris M., James W. Lewis, Chun-Hai Wang, Alan A. Coelho, Hannah E. Johnston, Helen EA Brand, and John SO Evans. “3D Transition Metal Ordering and Rietveld Stacking Fault Quantification in the New Oxychalcogenides La2O2Cu2–4 x Cd2 x Se2.” Chemistry of Materials 28, no. 9 (2016): 3184-3195.
Stacking Faults in Diamond
The first example uses data simulated for stacking-faulted diamond containing intergrowths of the cubic diamond and hexagonall lonsdaelite forms with a 0.7 probability (pa) of ideal c–c and h–h stacking and a 0.3 probability (1–pa) of h–c or c–h faults. The data were simulated using the DIFFaX file dia.dat and are described in the paper linked here.
1. Save the datafile diffax_dia.xye and dia_tutorial_01.inp file in your working directory.
2. Read through the input file to give yourself some idea of what the different sections mean. If you’re familiar with DIFFaX and TOPAS it should be self explanatory. In the str section the c cell parameter is derived from the generated stack. The file is set up for a single sequence of stacked layers (Nstr 1) and there are 200 layers in the stack (Nv 200). Lines 23-25 describe the stacking vector and probabilities of going from layer A to layer A or layer A to layer B. The probability pa is defined as 0.7. Perfect cubic diamond would have pa = 1.0. Similar stacking data is then given for layer B. The positions of the carbon atoms within layers A and B are then given in standard topas format.
3. Try doing a refinement with TOPAS. Run the input file several times. Each time you’ll see you get a diffraction pattern that approximates the data with with Rwp of ~4.5-6.5%. The fit is different every time as there are only a finite number of layers in the stack so each structural model generated is different. As there are only 200 layers in the stack there are a limited number of hkl reflections predicted so you see ripples in the simulation. The matrix given in the TOPAS “run” window tells you how many of each type of layer were generated in each stack. Note (April 2026): if the INP file crashes it may be because the specific stochastic set of layers generated in a run is too far away from containing a 70%:30% ratio of A and B to be accepted by TOPAS. If this happens try increasing to 500 layers in the stack.
4. Try increasing Nv to 5000 so there are 5000 layers in the stack. The Rwp will intially be very high (~1000 %) as the scale factor is way off. It should rapidly refine to give Rwp ~1.2%. If you run the file several times you’ll see you always get Rwp around 1.1-1.3%. Zoom in on the 40-50 degree region. You’ll see that the smooth peak shape is generated by summing thousands of hkl reflections [ (0 1 1), (0 1 2), (0 1 3), …. (0 1 1851),….]. In the TOPAS run screen you’ll see that there are 236143 hkl reflections in the 2-theta range calculated but only 2760 are used in the peaks buffer as many of the reflections can be dealt with collectively with no loss in accuracy. The use of the peaks buffer reduces memory usage and increases speed.
5. Change the value of the stacking fault probability pa to 0.8 to see how much the pattern changes. Change it to 0.9999 to see the sharp peaks of an unfaulted “perfect diamond” sample.
6. Set pa back to 0.7 and set the number of layers Nv back to 200 (or 500). Make sure you get Rwp around 4.5-6.5% as in step 3. Note that there are only 9450 hkl reflections in the 2-theta range with 1427 used in the peak buffer.
7. Now change Nstr to 100 (this produces 100 sequences each with 200 stacked layers) and run the refinement again. You should get an excellent fit to the data (Rwp ~0.8%) as you’re now averaging the pattern from 100 stacks. Note that the refinement runs almost as quickly as in step 6 (0.37 vs 0.23 s for 4 cycles on my computer) despite having 100 times the number of layers. Run the refinement several times and you should get an essentially identical Rwp each time.
8. Now change Nv to 100 so you have 100 lots of 100 layers. This time you should get Rwp ~ 2.9%. You’ll see “ripples” in the calculated pattern due to the small number of hkl reflections being used due to the shorter c axis.
9. At the bottom of the file include the SF_smooth macro as: SF_smooth(@, 1, 1). This applies an intelligent convolution to smooth out the ripples. You should get a fit as good as that in step 7 with less computational time.
10. Extra work: try downloading cif files for unfaulted diamond and lonsdaelite and simulate their powder patterns. Try fitting them with the stacking fault approch. For unfaulted materials it can be safer to use a fault probability of 0.9999 rather than 1.0.
Clustered faults in Diamond
This tutorial uses the clustdia.dat example from DIFFaX which has more complex clusters of different layer intergrowths as described in the DIFFaX manual.
1. Save the files clustdia_tutorial_01.inp and clustdia.xye in your directory.
2. Open the input file. You’ll see it is very similar to the example above. Note in the “Transition” section that the distance from one layer to another is defined by the parameter h (height), which is the distance in Angstroms between layers (shifts in a and b plane are in fractional coordinates). There are 4 layers defined which have two basic types A and B. You’ll see that pa has a high value (0.9). There is therefore a high probability for clusters of type 1 to form (11111) which is a cubic sequence. Transition 1 to 2 creates a stacking fault. 2-3 is then a hexagonal sequence. The layer model copied from the DIFFaX input file is at the end of the tutorial.
3. Run the file. You should get Rwp ~1.6%.
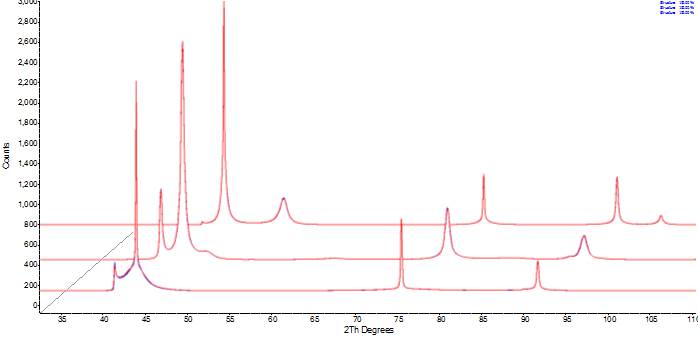
Stacking faults in Cu metal
This tutorial uses the cu.dat example from DIFFaX for random hexagonal intergrowths in copper metal. A cubic stacking sequence has layers 11111 or 22222; a hexagonal stacking sequence is 121212…
1. Save files cu_tutorial_01.inp and cu.xye to your directory.
2. The input file is set up for Nstr = 100 sequences each with Nv = 500 layers with pa = 0.9999 which gives “unfaulted” cubic Cu. You should get Rwp around 31%. Note that some experimental reflections are significantly broadened relative to others.
3. Try stacking fault probabilities of pa = 0.95, 0.90, 0.85. Note the Rwp values and the quality of fit.
4. You should get Rwp=1.47% for pa = 0.90 corresponding to a 10% faulting probability.
5. Extra work: try using the TOPAS #list command to systematically step through different pa values to monitor Rwp changes.
Clustdia.dat stacking model
Taken from the DIFFaX example file clustdia.dat:
{There are four layers in total, two of which are}
{structurally distinct. They are related by a mirror}
{in the a-b plane, and are labelled layers A and A'.}
{Layer 1 is an A layer which is preceded by an A layer}
{Layer 2 is an A' layer which is preceded by an A layer}
{Layer 3 is an A layer which is preceded by an A' layer}
{Layer 4 is an A' layer which is preceded by an A' layer}
{1 - 1 is a cubic stacking transition}
{1 - 2 is a stacking fault in a cubic sequence}
{1 - 3 cannot occur}
{1 - 4 cannot occur}
{2 - 1 cannot occur}
{2 - 2 cannot occur}
{2 - 3 is a hexagonal stacking transition}
{2 - 4 is a fault in a hexagonal sequence}
{3 - 1 is a fault in a hexagonal sequence}
{3 - 2 is a hexagonal stacking transition}
{3 - 3 cannot occur}
{3 - 4 cannot occur}
{4 - 1 cannot occur}
{4 - 2 cannot occur}
{4 - 3 is a stacking fault in a cubic sequence}
{4 - 4 is a cubic stacking transition}
{In this file. . .}
{the probability of a fault in cubic stacking = 1-2 = 4-3 = 10%}
{ thus, 1-1 = 4-4 = 90%}
{the probability of a fault in hexagonal stacking = 2-4 = 3-1 = 20%}
{ thus, 2-3 = 3-2 = 80%}