tutorial_zrmo2o8_vt
ZrMo2O8 in situ synthesis
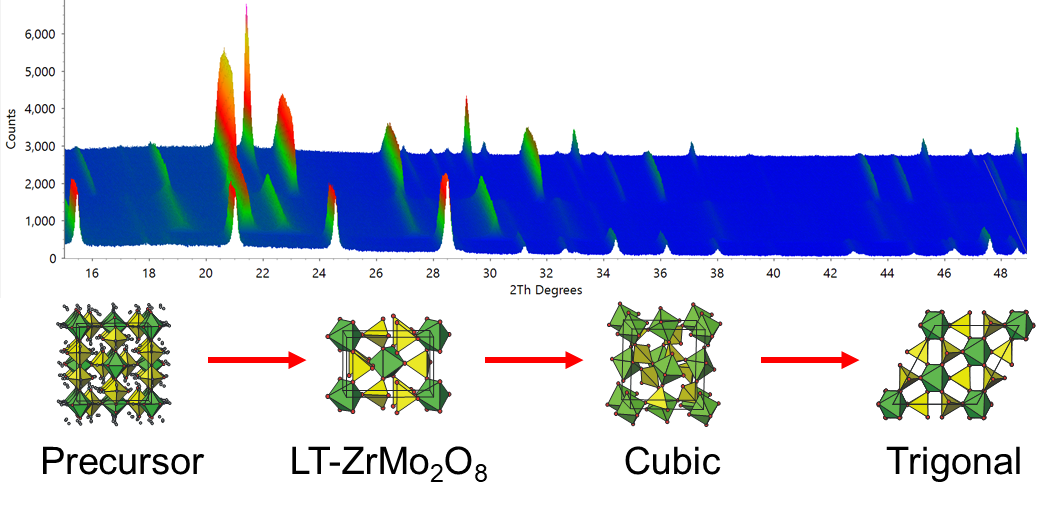
Learning outcomes: this tutorial will take you through the automated analysis of a moderately complex in situ powder diffraction experiment. The example is taken from our publication on the synthesis of the metastable negative thermal expansion material cubic ZrMo2O8. The key to synthesising this material is to transform the crystalline precursor material ZrMo2O7(OH)2.2H2O topotactically to LT-ZrMo2O8 then on to the desired metastable cubic material. If you heat too high (or for too long) then the cubic material transforms to the thermodynamically more stable trigonal form. In situ powder diffraction was crucial in optimising the synthesis.
The tutorial takes you through setting up a 4-phase Rietveld input file, then automating the Rietveld analysis.
The data were recorded on a Bruker d8 diffractometer with a Vantec detector and a Ge(111) monochromator giving Cu Ka1 radiation. The sample was warmed from 300 K to 1123 K in 10 K steps over ~40 hours using an Anton Paar htk1200 furnace. We will analyse the first 68 powder patterns, after which the sample decomposes.
You might like to try the simpler tutorial on Al2O3/Si which has an accompanying YouTube video. This also describes the TOPAS 3D viewer.
Files needed: single zip file
Setting up 4 phase Rietveld refinement
1. Extract the data from the .zip file. Load d8_01612.raw into TOPAS (File/Load scan files) and view the data in 3D (the blue/red triangle icon).
2. Set up to do a 4 phase Rietveld fit of d8_01612.raw. The instrument used was “BB_CuKa1_Ge111_PSD Durham d8”. I suggest you insert the 4 cif files in the order: zrmo2o8_prec.cif, zrmo2o8_lt.cif, zrmo2o8_cubic.cif, zrmo2o8_trigonal.cif. With topas-editor each phase gets given appropriate independent parameter names.
3. For the trigonal phase make sure you put the x and y coordinates of Zr2 to “=1/3;” and “=2/3;” as the atom lies on a special position.
4. Try running the file in TOPAS with the default parameters refining. The first pattern (range) will be fitted. You should get Rwp ~9.5% and the Rietveld will report a weight percentage of the precursor phase of ~98%.
5. The Bruker RAW file contains 82 patterns (ranges) in total. Range 22 (547 K) contains predominantly the LT intermediate phase. Try fitting this range by typing “range 22” on the line after the xdd filename. You should get Rwp ~12.5% and 89% LT phase. This phase has a marked hkl-dependent peak shape, so the fit won’t be great.
6. Try fitting range 50 (803 K) where the cubic phase is predominant (Rwp 10.7%) then range 65 (953 K) where there is a mixture of cubic and trigonal ZrMo2O8 present.
7. By just changing the range number you can rapidly fit each pattern in turn. This process is automated in the enxt section.
8. This INP file is in the .zip as d8_01612_fit_01.inp.
Automated refinement
1. The refinement can be automated with the TOPAS #list syntax as discussed in the tutorial on Al2O3/Si. The INP file you created above needs editing to include the relevant instructions. To save typing this is done for you in file d8_01612_vt_02.inp.
2. Open d8_01612_vt_02.inp and read through it.
(a) Section 2 contains instructions on fitting either a specified range or all ranges by commenting in/out the line “#define fit_one_test_pattern“. The #list command contains the filename, range number and temperature for each pattern. With one data file naming the filename each time is redundant, but in many experiments the filename will change.
(b) Section 3 contains the four strs. They’ve been edited so there is a single overall temperature factor and most phases have a simple size (Gaussian) and microstrain (Lorentzian) peak shape sample contribution. LT-ZrMo2O8 is a bit more complex due to hkl-dependent peak shapes. These are described using a spherical harmonic function as detailed on P124 of Chapter 4 of the TOPAS Rietveld Refinement text book. The instrumental resolution function is described by a TCHZ() pseudo-voigt that was determined using a highly crystalline standard.
(c) Section 4 contains the instructions to write parameters of interest to a file called results.txt. These lines can be auto-generated in topas-editor with “right click/topas-editor commands/Topas insert output lines automatically”. If you add more output there’s a “right click/topas-editor” command to update the column labelling line.
3. If you run this file all data sets should be analysed sequentially and the results written to results.txt.
4. You can look at the fits in the TOPAS 3D viewer. Plot the results in whatever software you like. The .zip file contains a python script called plot_results.py. This will produce graphs like the ones below.
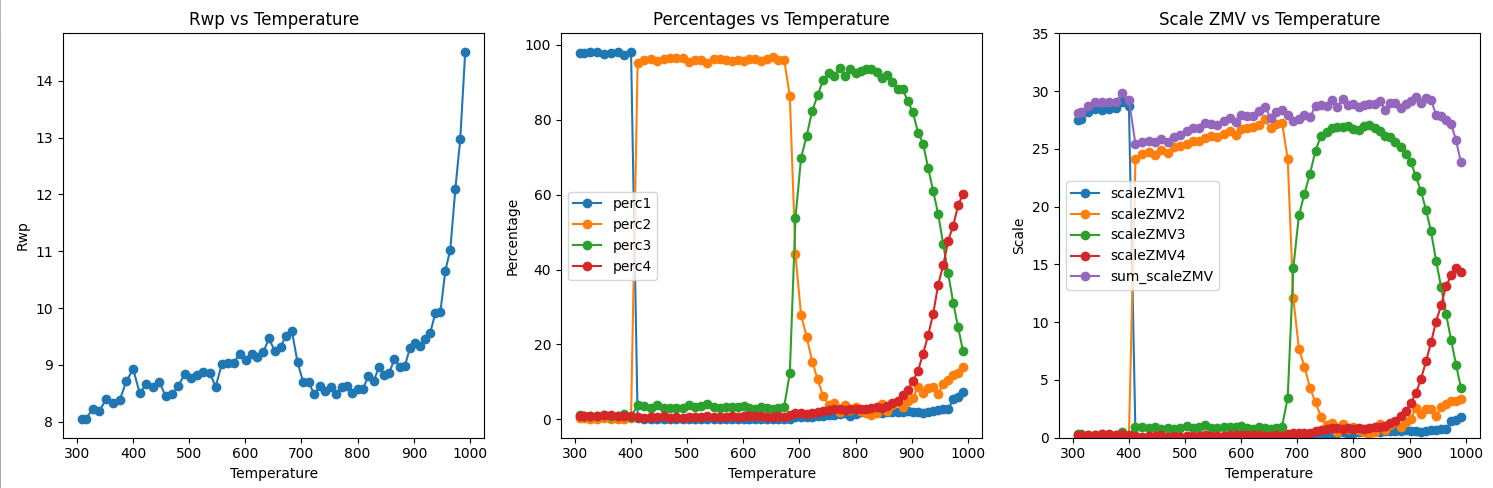
5. The left hand plot shows Rwp vs Temperature. The fits have similar Rwp’s of ~9% until ~950 K. Above this temperature the ZrMo2O8 decomposes to ZrO2 and MoO3 which are not part of the Rietveld model. The middle plot shows the % of each phase present as a function of temperature. You can see that the cubic phase (which we were trying to make) forms at about 800 K. If the temperature is either too low or too high (or different heating rates are used), other phases form. The right hand plot shows scale*Z*mass*volume for each phase and the sum (purple). The fact that the sum of scale*ZMV is essentially constant shows that each transition is from a crystalline material to a crystalline material. If a significant amount of an amorphous phase was formed at any point in the reaction then peak intensity would “disappear” from the powder pattern and scale*ZMV would decrease. The small decrease from the precursor to the LT phase seen in this analysis is probably caused by the difficulties in fitting the hkl-dependent peak shape of this poorly crystalline phase with the simple model used.
6. One of the difficulties with automated refinements is making sure that each refinement converges to the true minimum and that parameters for phases that are not present in a given pattern don’t refine to non-sensical values. Look through the INP file and note some of the tricks used. These include:
a. Using a simple two-parameter peak shape for each phase with min/max values to prevent peaks becoming “infinitely broad” and fitting the background.
b. Limiting cell parameters to sensible ranges.
c. Keeping the structural model simple, e.g. refining a single overall temperature factor, putting limits on any refined coordinate, etc.
7. With these controls in place the refinements should always converge even if you arbitrarily jump between ranges e.g. range 1 to 22 to 51 to 12 to 39. You could try removing some of the limits and see how this affects convergence. e.g. try removing the min/max controls on size/strain parameters; try using multiple temperature factors on different phases, try removing limits on cell parameters. Make an archive copy (ctrl-tx) of your INP file first. There are more tips on controlling sequential refinements in the notes on sequential refinement on the topas wiki.
8. You might want to practice by converting your 4 phase INP file into the format needed for automated analysis.
9. If you’re curious, plot the cell parameters of the different phases. What’s unusual about cubic ZrMo2O8? What do you notice for LT-ZrMo2O8?
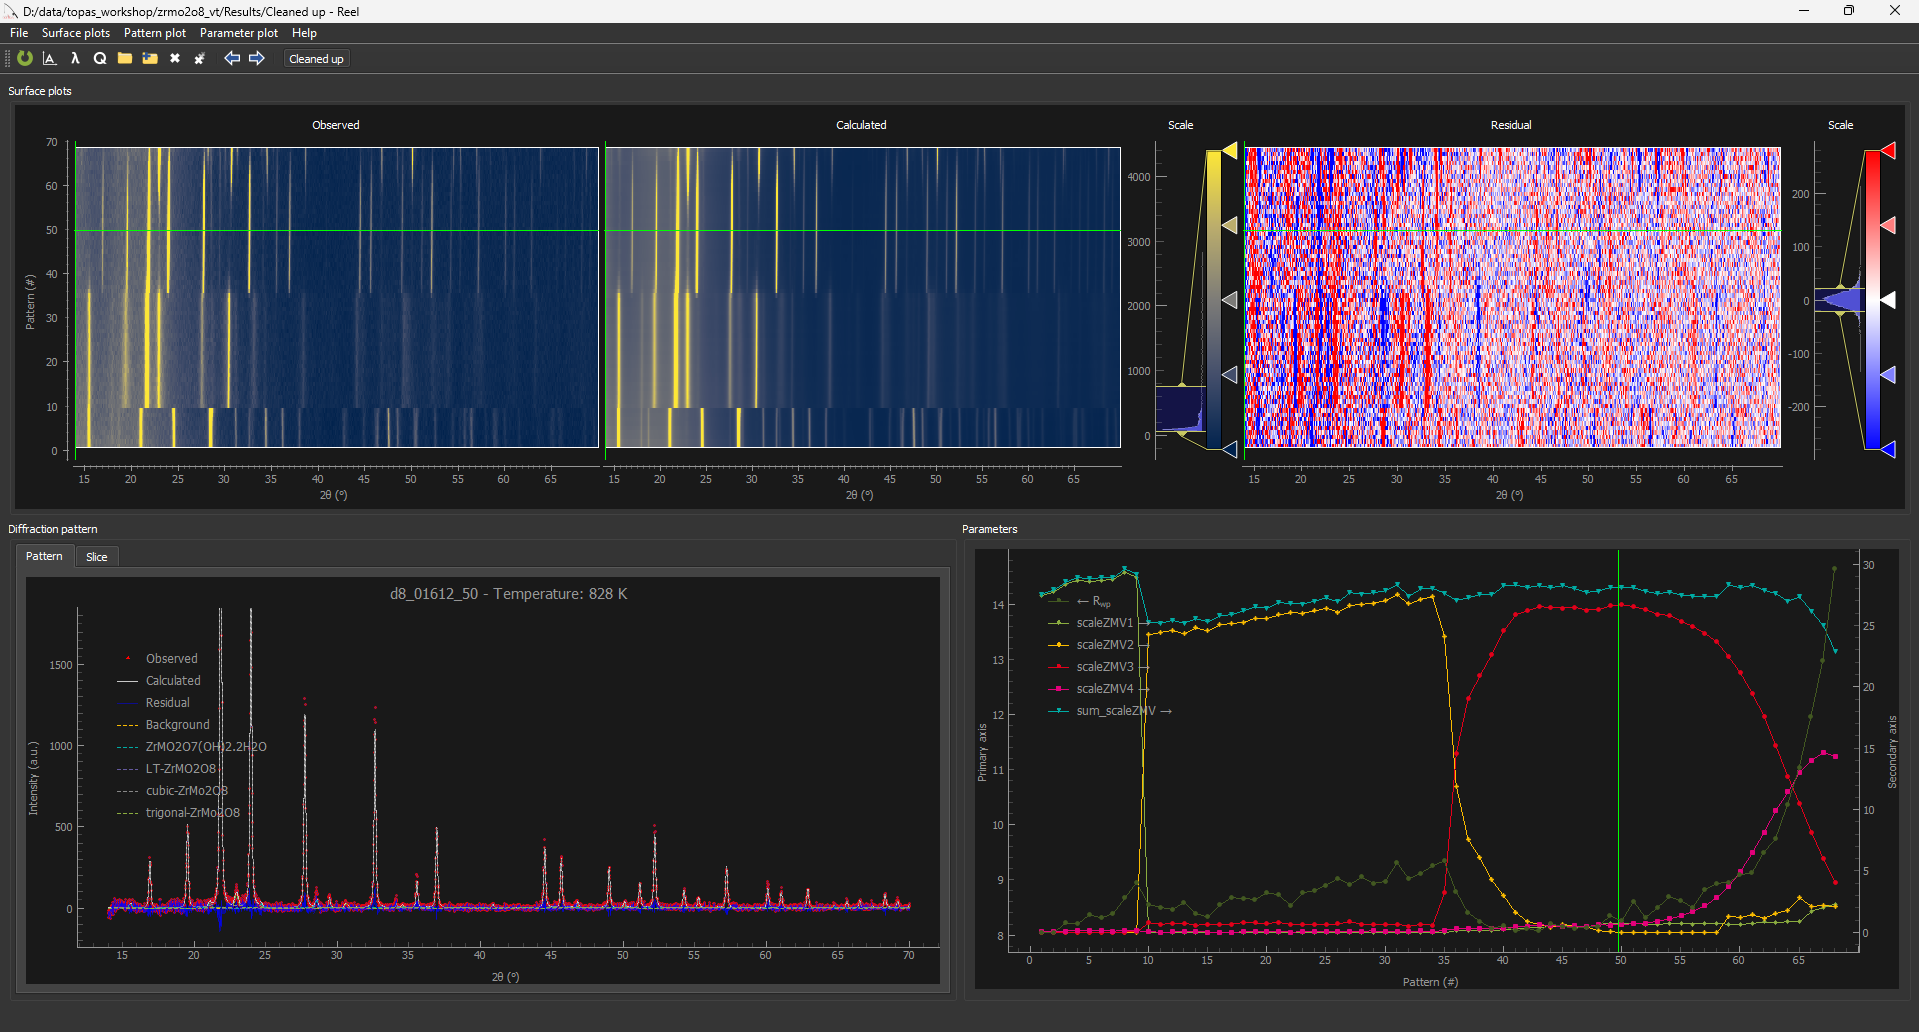
Using Reel for visualisation
Reel is a nice piece of software for visualising multiple Rietveld fits written by the Aarhus group. As in the screenshot below, you can view (top row) observed, calculated and difference surfaces alongside the conventional Rietveld fit (bottom left) and any other parmeters you’re interested in (bottom right). You can drag the horizontal or vertical green bars to view different patterns.
1. The file d8_01612_reel_01.inp is set up to produce the format required for Reel. Each data set is fitted once and the conventional Rietveld plot saved to a .xyy format for Reel. The Rietveld calculations is then repeated with zero iterations with all scales set to zero to output the background curve, then multiple times with scales on all but one phase set to zero to produce the contributions from each str. The full fit is then recalculated so it can be seen in the TOPAS gui. At the end of the run a python script rewrites the .xyy files into the correct format for Reel. This should happen automatically if the .py file is in the same folder. If not, type “python .\topas_autoClean_Reel.py .\Results\” in a powershell.
2. A traditional results.txt file is also written that can contain the same or different output parameters. It can again be autogenerated with “topas-editor/right-click” commands.
3. All .xyy files can be read into reel with a “select all” (ctrl-A) command. You can superimpose parameters on the Rwp plot. You can e.g. subtract background from the Rietveld 2D plot or view the surface plots on Sqrt or log scales.
3. topas-editor has commands for producing the more complex sections in the Reel INP file automatically. They are in the “TOPAS_Durham/miscellaneous useful commands” folder or you can find them by typing shift-ctrl-p and typing “reel” in the dialog box.